Power用户高级版 1.6.1907.0
Power-user add-in: smart tools for PowerPoint, Excel and Word - Templates, Icons, Charts, Maps, Diagrams and more! Power-user provides you with a deep library of templates, icons, charts, maps, and diagrams for your spreadsheets and presentations. With Power-user for PowerPoint and Excel, you’ll draw the attention of your audience with stunning graphics that are sure to impress. Create stunning documents to impress clients and managers with your skills on PowerPoint, Excel & Word.
Increase your productivity by up to 50% to meet deadlines, save time and reduce labor costs
Focus on making an impact instead of spending your time on low added-value tasks like formatting
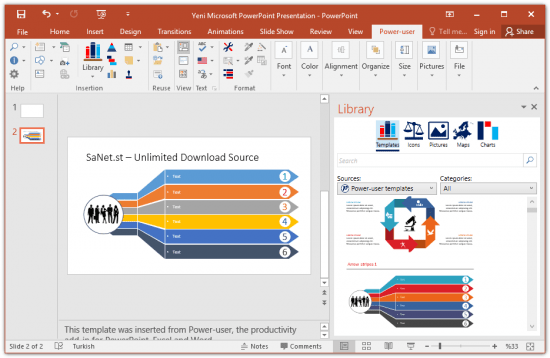
LIBRARY OF TEMPLATES FOR POWERPOINT, EXCEL & WORD Don't reinvent the wheel for every slide or document. Access hundreds of professionally designed templates from the Power-user add-in's library, and insert them in 1 click. Templates will automatically adjust to your own color scheme. You can also save your own slides or documents in the templates library to keep them accessible anytime. Or you can create shared libraries for all users in your organization.
ICONS & FLAGS Power-user comes with a collection of 3,000 icons and all country flags to illustrate your slides. Icons are vector shapes so you can resize them without deformation and recolor them as you with. With Power-user you can search icons by categories and with different keywords associated to the same icon to let you find the right icon in just 2 seconds.
DATA MAPS Our 200+ data maps are powerful tools to illustrate ideas with a geographical dimension. Those maps are fully editable, and can be colored automatically based on your Excel data. Within minutes, you can create beautiful maps that will immediately convince your audience.
WATERFALL CHARTS Waterfall charts are very popular in finance and consulting. They are great to break down your data into multiple components, illustrating for instance what postively or negatively impacts a KPI.
MEKKO CHARTS Create Mekko charts in PowerPoint, Excel or Word with Power-user. Mekko are one of the most powerful chart types. It can represents 3 dimensions of data, and is popular in consulting to show market positions of different companies for instance.
SANKEY CHARTS Instantly insert breathtaking Sankey charts in PowerPoint, Excel or Word with the Power-user add-in. Sankey are very effective to illustrate flows such as transactions, exportations, migrations etc. Sankey Charts can be edited dynamically through a simple and intuitive interface.
PICTURES Sometimes a good picture tells more than a thousand words. Power-user allows you to browse over 100,000+ pictures and insert them with 1 click. it's ideal to illustrate concepts or trigger a discussion, without worrying about intellectual property rights. Pictures are inserted in PowerPoint with a size already optimized for your slides.
DIAGRAMS Embed customized diagrams in no time with Power-user. Diagrams are a powerful tool to illustrate complex ideas and build eloquent slides or dashboards in little time. Diagrams include value chains, gauges, traffic lights, relationships, pyramids, arrows and more.
GANTT CHARTS Use Gantt charts to illustrate the different phases of a project and their progress. Creating this manually can take hours. With the add-in, you can create them in a few seconds only. It's a great tool to improve the design of a slide in very little time.
POWERPOINT TOOLS - Sticky notes, a helpful solution to add comments to your slides and share them with your teamworkers - Stamps, a solution to instantly mark or un-mark all your slides as "Draft" or "Confidential" - Mini-slides, to refer to a slide from earlier in the presentation, - Slide summaries, listing the titles of all selected slides, - Progress tools, to show the audience how far in the presentation you are.
What's new
Power-user works with any version of Windows above Windows 8, with .NET Framework 4.8 or higher.
用户高级插件:为 PowerPoint、Excel 和 Word 提供的智能工具 - 模板、图标、图表、地图、图示等! Power User 为您提供了一个深受欢迎的模板、图标、图表和图示库,用于电子表格和演示文稿。凭借 Power User 的 PowerPoint 和 Excel 版本,您可以让观众注意到您的幻灯片上令人印象深刻的图形,这些图形肯定会给人留下深刻的印象。在 PowerPoint、Excel 及 Word 上展示技能以 impress 客户和经理。 提高生产力 最多可提高50%的工作效率来满足截止日期,节省时间并减少劳动力成本 专注于做出影响 而不是花费时间在低附加值的任务上,比如格式化 PowerPoint、Excel 和 Word 的模板库 不要为每张幻灯片或文档重新设计。从 Power User 插件库中访问数百个专业设计的模板,并一键插入其中。模板将自动调整以适应您的颜色方案。您还可以保存自己的幻灯片或文档到模板库中,以便随时访问它们。或者您可以创建组织内所有用户共享的模板库。 图标和旗帜 Power User 配备了 3,000 多个图标和国家国旗以说明幻灯片。图标是矢量形状,因此您可以调整大小而不会变形,并且可以重新上色。借助 Power User 您可以通过分类搜索图标,并与同一个图标相关的不同关键词来找到正确的图标,在两秒钟内。 数据地图 我们提供了 200 多种数据地图,用于通过地理维度来阐明想法。这些地图是完全可编辑的,并可以根据您 Excel 中的数据自动着色。只需几分钟,您就可以创建令人信服的地图,并立即说服您的观众。 瀑布图 瀑布图在金融和咨询领域非常流行。它们非常适合将您的数据分解为多个组件,例如影响关键绩效指标(KPI)的正或负因素。 Mekko 图表 使用 Power User 在 PowerPoint、Excel 或 Word 中创建 Mekko 图表。Mekko 是一种最强大的图表类型之一。它可以代表 3 种数据维度,并且在咨询中用于显示不同公司的市场地位等情形。 Sankey 图表 只需几秒钟,即可通过 Power User 插件插入令人惊叹的 Sankey 图表。Sankey 非常有效于说明诸如交易、出口、迁移等流程的数据。 可以使用简单的直观界面进行动态编辑。 图片 有时候一张好的图片胜过千言万语。Power User 允许您浏览超过 10 万张图片,并在一键插入它们。它非常适合用来阐述概念或触发讨论,而无需担心知识产权问题。图片已经在幻灯片上优化了大小以插入 PowerPoint。 图示 使用 Power User 一眨眼之间即可嵌入定制的图示。图示是一种强大的工具,用于阐明复杂想法并快速构建引人注目的幻灯片或仪表板。 图示包括价值链、指针式表盘、交通信号灯、关系、金字塔和箭头等。 甘特图 使用甘特图来说明项目的不同阶段及其进展情况。手工创建需要数小时的时间。通过插件,您可以仅用几秒钟就创建它们。这是一个很好的工具,可以在极短的时间内提高幻灯片的设计质量。 PowerPoint 工具 - 便签:为添加评论到幻灯片并在团队成员之间分享提供了一个有用的解决方案。 - 标记:一种立即标记或取消标记所有幻灯片为“草稿”或“机密”的解决方案。 - 简短的幻灯片,以便从演示文稿中的早期幻灯片跳转, - 摘要幻灯片,列出所有选中幻灯片的标题, - 进度工具,以显示观众您在演示过程中进展到了何处。 新特性 Power User 与 Windows 上任何一个版本高于 Windows 8 的操作系统和 .NET Framework 版本4.8 或更高版本兼容。
本站不对文件进行储存,仅提供文件链接,请自行下载,本站不对文件内容负责,请自行判断文件是否安全,如发现文件有侵权行为,请联系管理员删除。
Puremagnetik Mimik OD 1.0.2/1.0.1 (Win/macOS)
Math Resource Studio Enterprise 7.1.103
Math Resource Studio Enterprise 7.1.103 Portable
Adobe Premiere Pro 2025 v25.0 (x64) Multilingual
LibRaw Monochrome2DNG 1.7.0.72 (x64)
Windows 11 Pro Lite / SuperLite / UltraLite 24H2 Build 26100.2033 x64 Multilanguage October 2024 AnkhTech
WindowTop Pro 5.23.5 Multilingual
SQLite Expert Professional 5.5.25.636 (x64)
Easy Gamer Utility PRO 1.3.48
SoftPerfect NetWorx 7.2.1.0 Multilingual