MedCalc 23.0.5 多语言版本

Statistical software for biomedical research with a rich set of functions, graph types and an advanced module for performing ROC graph analysis. MedCalc is designed to meet the requirements of biomedical researchers with respect to the statistical analysis of large datasets. It provides the necessary tools and features for performing Receiver Operating Characteristic curve analysis, data plotting, Bablok and Deming regression and more.
With an integrated spreadsheet with over 100,000 rows, MedCalc is capable of reading and displaying detailed data imported from Excel, SPSS, Dbase, Lotus or extracted from SYLK, DIF or text files. The information can be easily sorted, filtered or edited.
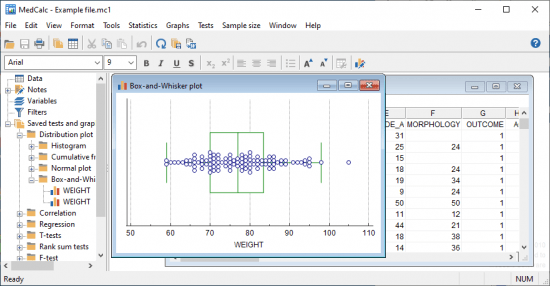
The built-in data browser offers a comfortable means of easily managing data, variables, notes, texts and graphs, while the array of supported graphs and diagrams (scatter plots, method comparison graphs, graphs for subgroups or for up to 24 continuous variables, survival curves, serial measurement, standardized mean plots and many more) make it perfect for analyzing trends and comparing information.
One of the most important features of MedCalc is related to its ROC curve analysis capabilities. It can generate the ROC curve graph with 95% confidence bounds, calculate specificity, sensitivity, predictive values for all the thresholds, likelihood ratios, generate conclusive plots and determine the size of an area under the ROC graph. Up to 6 ROC curves can be compared, calculating the differences between the areas, the standard errors, P-values and more.
MedCalc is capable of handling missing data, creating subgroups, calculating percentile ranks and power transformation. It features outlier detection, correlation and regression tools, Bland & Altman plotting, while also enabling you to run Anova, variance ratio, mean, propertion, Chi-Square, Fisher and T-tests.
A summary of the statistical report can be easily generated and data can be placed and viewed side-by-side thanks to the multiple comparison graphs function. MedCalc requires at least basic statistics knowledge in order to get the most out of its potential. Its extensive array of features make it a must-have tool for running method comparison studies and analyzing biomedical data.
Whats New
统计软件适用于生物医学研究,功能丰富、图表类型多样,并且拥有先进的模块用于执行ROC图分析。MedCalc旨在满足生物医学研究人员在处理大数据集时的统计分析需求。它提供了进行接收者操作特性曲线分析、数据绘图、巴博斯(Bablok)和戴明(Deming)回归等所需工具和功能。 MedCalc具有集成的电子表格,能够读取并显示来自Excel、SPSS、DBASE、Lotus或从SYLK、DIF或文本文件中提取的数据。信息可以轻松地进行排序、过滤或编辑。 内置的数据浏览器提供了一种方便的方式来管理数据、变量、注释、文字和图表,而支持的图形和图示(散点图、方法比较图、子组或多达24个连续变量的图、生存曲线、序列测量、标准化均值图等)使其非常适合分析趋势并对比信息。 MedCalc的一个重要特点是其ROC曲线分析能力。它可以生成带有95%置信界限的ROC曲线图,计算特异度、敏感性、阈值的所有预测值、似然比,并生成结论性图表以确定ROC曲线下面积的大小。最多可以比较6个ROC曲线,并计算它们之间的差异、标准误差、P值等。 MedCalc能够处理缺失数据,创建子组,计算百分位数和幂变换。它还具有异常检测、相关性和回归工具、Bland & Altman图绘制功能,同时支持ANOVA、方差比率、均值、比例、卡方、Fisher和T检验。 用户可以通过多重比较图表功能轻松生成统计报告摘要,并通过将数据放置在侧面以供查看来完成侧视图操作。 MedCalc需要具备基本的统计数据知识才能充分发挥其潜力。它广泛的功能使其成为进行方法对比研究和分析生物医学数据的必备工具。 新版本总结
本站不对文件进行储存,仅提供文件链接,请自行下载,本站不对文件内容负责,请自行判断文件是否安全,如发现文件有侵权行为,请联系管理员删除。
Puremagnetik Mimik OD 1.0.2/1.0.1 (Win/macOS)
Math Resource Studio Enterprise 7.1.103
Math Resource Studio Enterprise 7.1.103 Portable
Adobe Premiere Pro 2025 v25.0 (x64) Multilingual
LibRaw Monochrome2DNG 1.7.0.72 (x64)
Windows 11 Pro Lite / SuperLite / UltraLite 24H2 Build 26100.2033 x64 Multilanguage October 2024 AnkhTech
WindowTop Pro 5.23.5 Multilingual
SQLite Expert Professional 5.5.25.636 (x64)
Easy Gamer Utility PRO 1.3.48
SoftPerfect NetWorx 7.2.1.0 Multilingual