SysGauge 11.2.18
SysGauge is a system and performance monitoring utility allowing one to monitor the CPU usage, memory usage, network transfer rate, operating system performance, the status and resource usage of running processes, file system performance, USB performance, disk space usage, disk read activity, disk write activity, disk read transfer rate, disk write transfer rate, disk read IOPS and disk write IOPS for individual logical disks or all physical disks installed in the computer.
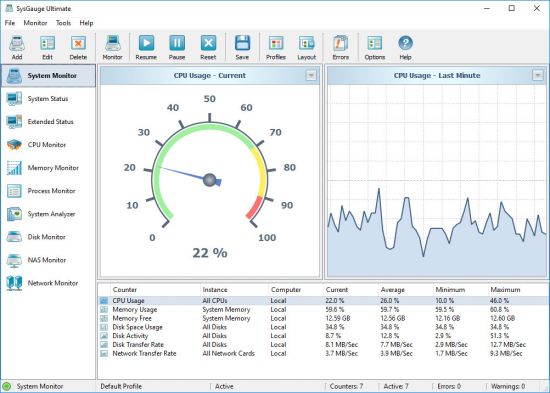
SysGauge Main GUI Application The main SysGauge GUI application allows one to configure a number of system and performance monitoring counters, display system monitoring charts, analyze the current system status, save various types of system monitoring reports and configure sound and E-Mail notifications.
SysGauge System Monitor The 'System Monitor' GUI module allows one to perform various types of system monitoring operations using one or more pre-defined or user-custom system monitoring profiles. The system monitor provides the ability to add, edit or delete system monitoring counters, save various types of system monitoring reports, configure monitoring rules, actions and error E-Mail notifications.
Add Counter Dialog The 'Add Counter' dialog provides the ability to add the CPU usage counters, memory usage counters, disk activity counters, network activity counters, USB activity counters, operating system status counters, file system counters and running processes counters.
SysGauge CPU Monitor The 'CPU Monitor' GUI module is a dedicated CPU monitoring GUI module showing the total CPU usage, user CPU usage, kernel CPU usage, CPU interrupt time, CPU interrupt rate, the current CPU frequency, the C1 low-power state, C2 low-power state and C3 low-power state.
SysGauge Memory Monitor The 'Memory Monitor' GUI module is a dedicated memory monitoring module showing the memory usage, the amount of free memory, the amount of used memory, the size of the memory cache, the cache peak size, the cache fault rate, the page file usage, the page file peak usage and the page fault rate.
SysGauge Process Monitor The 'Process Monitor' GUI module is a dedicated process monitoring module showing the list of currently running processes and displaying for each process the process CPU usage, the memory usage, the number of threads, the number of handles, the number of process instances, the process data transfer rate, the process read transfer rate, the process write transfer rate, the process page fault rate and the amount of non-paged memory allocated by each running process.
Whats New
SysGauge 是一种系统和性能监控工具,允许用户监测CPU使用率、内存使用率、网络传输速率、操作系统性能、运行进程的状态和资源使用情况、文件系统的性能、USB性能、磁盘空间使用情况、磁盘读取活动、磁盘写入活动、磁盘读取传输速率、磁盘写入传输速率、磁盘读IOPS和磁盘写IOPS,针对单独的逻辑磁盘或计算机中安装的所有物理磁盘。 SysGauge 主界面应用 SysGauge 的主界面应用程序允许用户配置多个系统和性能监控计数器,显示系统监控图表,分析当前系统状态,并保存各种类型的操作系统监控报告以及配置声音和电子邮件通知。 SysGauge 系统监视器 ‘系统监视器’图形模块允许使用一个或多个预定义的或自定义系统监控配置文件进行各种类型的系统监视操作。系统监视器提供了添加、编辑或删除系统监控计数器,保存各种类型的操作系统监控报告的功能,还可以配置监控规则、行动和错误电子邮件通知。 添加计数器对话框 ‘添加计数器’对话框提供添加CPU使用率计数器、内存使用率计数器、磁盘活动计数器、网络活动计数器、USB活动计数器、操作系统状态计数器、文件系统计数器和运行进程计数器的能力。 SysGauge CPU监视器 ‘CPU监视器’图形模块是一个专门的CPU监视器图形模块,显示总CPU使用率、用户CPU使用率、内核CPU使用率、CPU中断时间、CPU中断速率、当前CPU频率、C1低功耗状态、C2低功耗状态和C3低功耗状态。 SysGauge 内存监视器 ‘内存监视器’图形模块是一个专门的内存监视器模块,显示内存使用情况、可用内存数量、已用内存数量、缓存大小、缓存峰值大小、缓存故障率、页文件使用情况、页文件峰值使用情况和页面错误率。 SysGauge 进程监视器 ‘进程监视器’图形模块是一个专门的进程监视器模块,显示当前正在运行的进程列表,并为每个进程显示CPU使用率、内存使用率、线程数量、打开句柄数、进程实例数、数据传输速率、读取传输速率、写入传输速率、页面错误率以及运行过程中分配的非页式内存量。 新特性
本站不对文件进行储存,仅提供文件链接,请自行下载,本站不对文件内容负责,请自行判断文件是否安全,如发现文件有侵权行为,请联系管理员删除。
Puremagnetik Mimik OD 1.0.2/1.0.1 (Win/macOS)
Math Resource Studio Enterprise 7.1.103
Math Resource Studio Enterprise 7.1.103 Portable
Adobe Premiere Pro 2025 v25.0 (x64) Multilingual
LibRaw Monochrome2DNG 1.7.0.72 (x64)
Windows 11 Pro Lite / SuperLite / UltraLite 24H2 Build 26100.2033 x64 Multilanguage October 2024 AnkhTech
WindowTop Pro 5.23.5 Multilingual
SQLite Expert Professional 5.5.25.636 (x64)
Easy Gamer Utility PRO 1.3.48
SoftPerfect NetWorx 7.2.1.0 Multilingual